lon_nyc
![]()
London has better weather than New York City
Everyone knows London is grey and drizzly, and NYC is vibrant and sunny. That’s the story. Here’s what the hourly weather records from 2005–2024 actually show — and why, on balance, London wins.
1. NYC is dramatically wetter and snowier
NYC receives ~55 % more rainfall by volume (~1,290 mm/yr vs ~840 mm/yr) and logs roughly twice as many rainy hours. It also gets ~13 snow days per year on average; London gets one or two. The “drizzly London” reputation is a myth: London has more overcast grey days but far less actual precipitation or hours of rainfall.
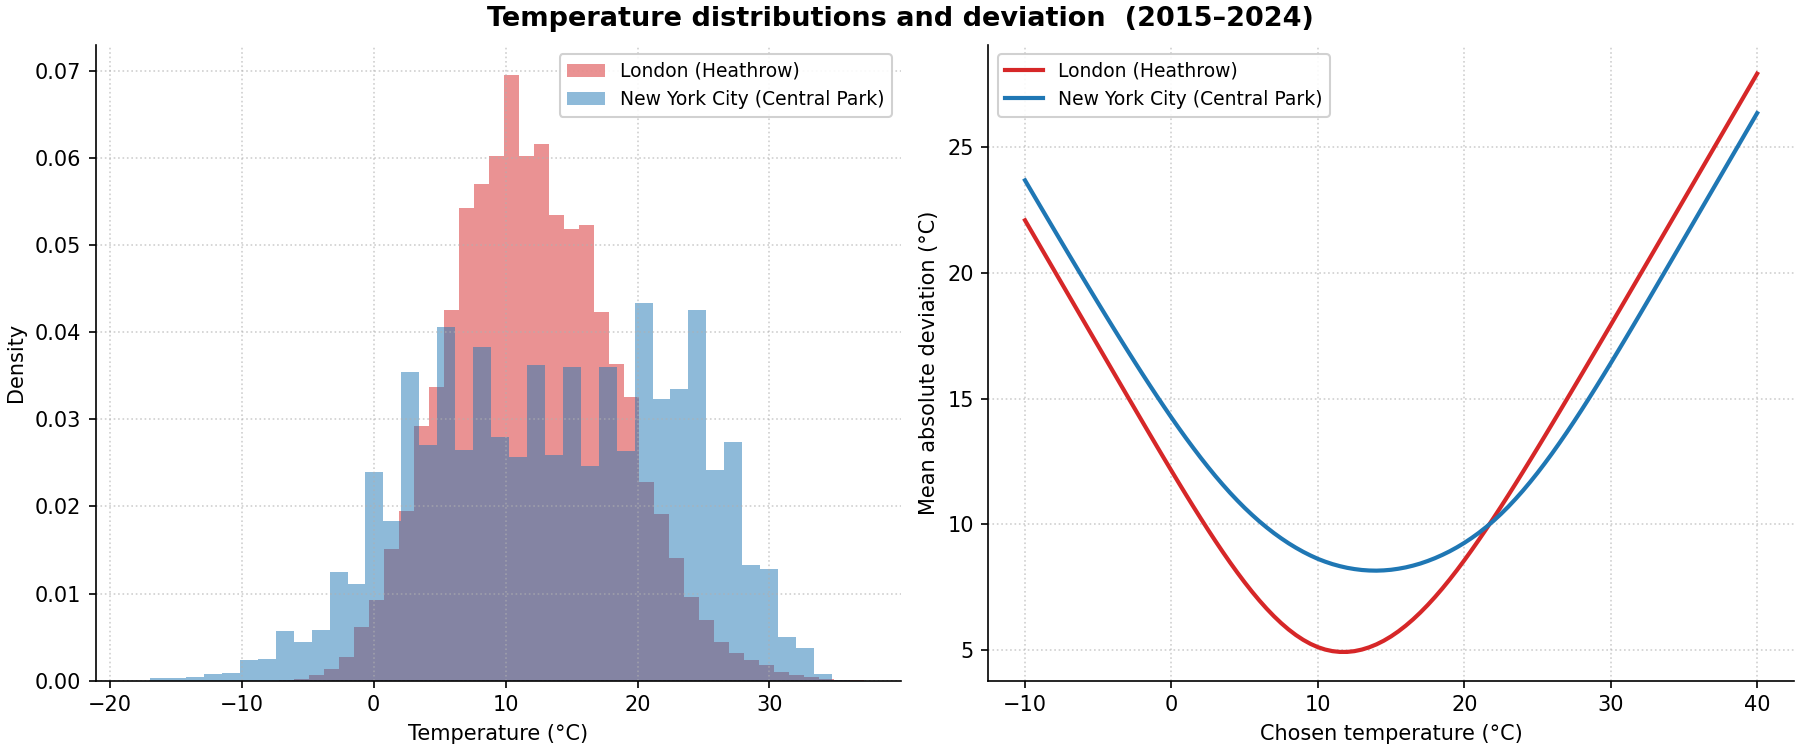
2. London’s temperature is almost perfect
London sits in a narrow, stable temperature band centred around 10–11 °C year-round. That sounds cold — but 13 °C is widely cited as the optimal temperature for casual running, and London is rarely far from it. The hourly temperature histogram is nearly Gaussian: a tight, symmetric peak. If you want an active lifestyle of running and cycling, London is ideal. You can step outside in a thin jumper virtually any day of the year and survive, which isn’t true for NYC.
NYC offers no such guarantee. Its winters are genuinely brutal — 400–1100 sub-freezing hours per year, compared to London’s 75–200. Its summers bake, with cooling degree-days 3–4× higher than London’s every single year. The temperature deviation curve (below) sits higher for NYC at every point on the scale — more discomfort in both directions, simultaneously.
3. Yes, NYC gets more sun — but that’s not entirely a good thing
NYC gets roughly 1,000 more sunshine hours per year than London (~2,535 vs ~1,546). More vitamin D, better Instagram lighting. Acknowledged.
But UV radiation ages skin and raises skin cancer risk roughly in proportion to sun exposure. The UK has one of the lowest melanoma rates in the world; the US does not. The sun you’re not getting in London is not purely a loss, although you should likely take vitamin D supplements in the winter.
4. The daylight advantage for NYC is real — but small
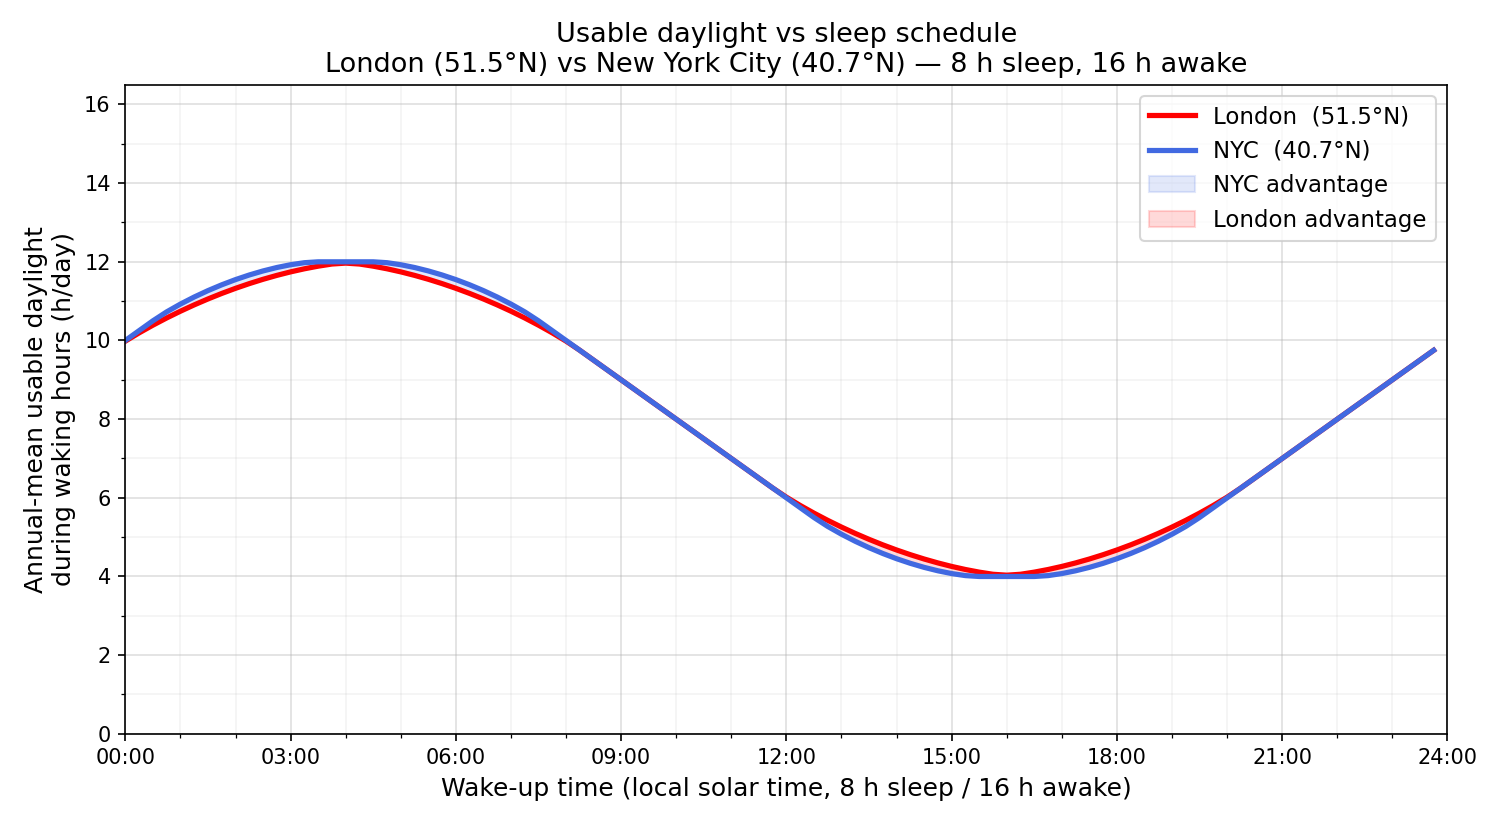
Ok, granted, you might say, but it is very dark in winter in London, with short days and dark commutes. This is of course true, and a consequence of their different latitudes: At 40.7°N vs London’s 51.5°N, NYC has more moderate day lengths year-round. But our analysis suggests that the practical difference in terms of the hours of your waking life you will spend in daylight over a year is very small. If you wake up between 06:00 and noon, NYC gives you at most ~12 minutes more usable daylight per day on average. That’s the entire advantage. Night owls actually get more usable evening light in London, thanks to its long summer evenings.
The verdict
London is wetter in reputation only. In reality it is drier, milder, more stable, gentler on the skin, and within rounding error on usable daylight for anyone with a normal sleep schedule. If you can tolerate grey skies — and you can, you get used to them — London’s climate is quietly excellent. London’s grey and foggy reputation likely dates to the Industrial Revolution, when a thick blanket of coal smog covered a city roamed by chimney sweeps, but this was never its natural climate.
The rest of this README documents the observational data sources, methodology, and full results tables for the analysis above. This repository should enable you to reproduce the analysis, and perhaps extend it to other cities or time periods.
Results (2015–2024)
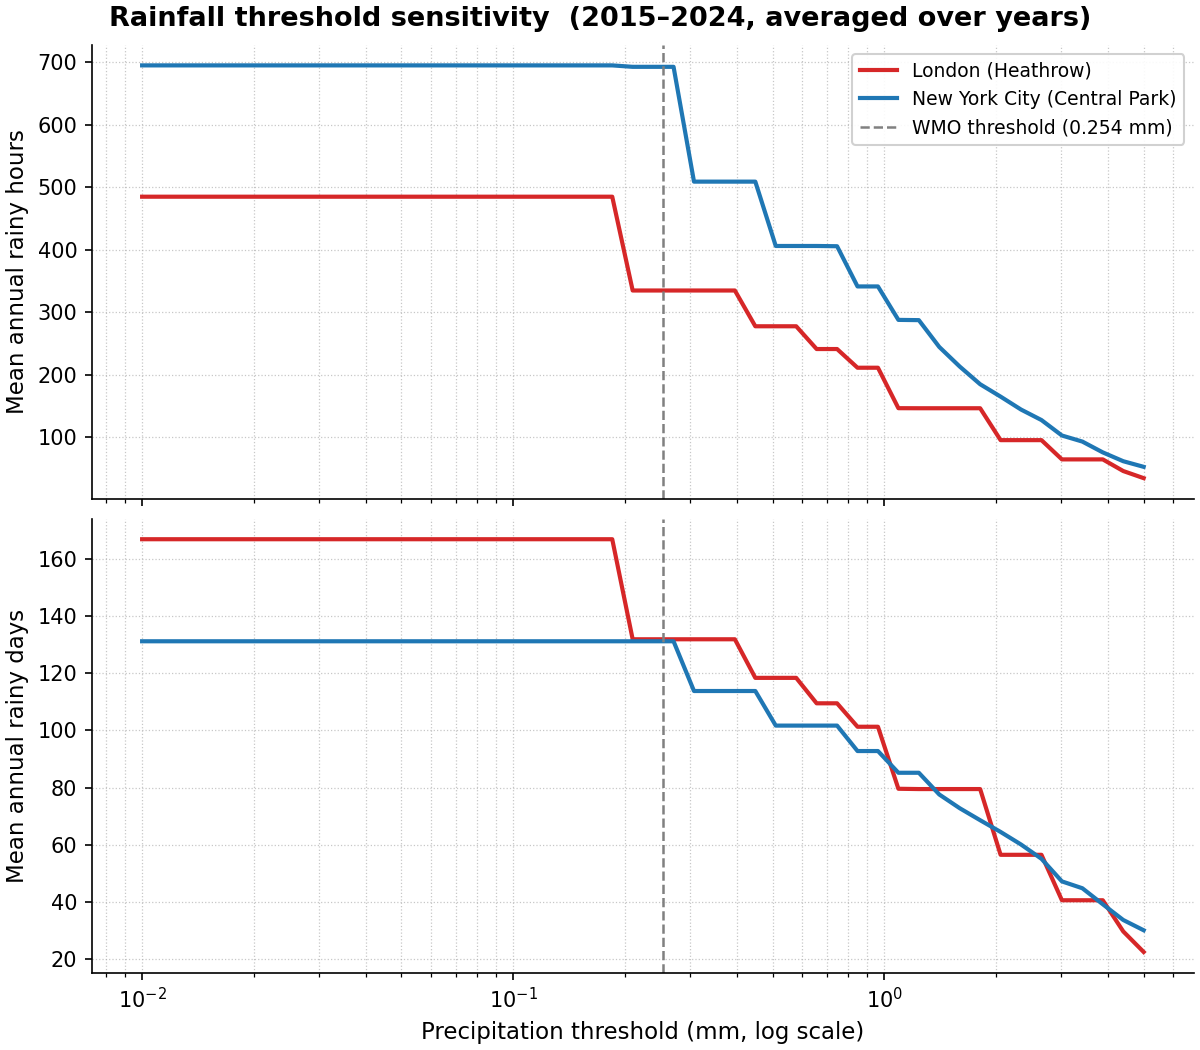
NYC leads on total rainfall and rainy hours every year. On rainy days, London leads in 5 of 10 years at the standard 0.254 mm threshold — consistent with its many low-intensity events — though NYC takes over as the threshold rises above ~1 mm.
Annual totals for 2015–2024 (2025 excluded as a partial year):
| Year | City | Total (mm) | Rainy hours | Rainy days |
|---|---|---|---|---|
| 2015 | London (Heathrow) | 820 | 278 | 136 |
| 2015 | New York City (Central Park) | 1047 | 598 | 114 |
| 2016 | London (Heathrow) | 856 | 273 | 128 |
| 2016 | New York City (Central Park) | 1071 | 556 | 117 |
| 2017 | London (Heathrow) | 846 | 268 | 132 |
| 2017 | New York City (Central Park) | 1158 | 639 | 130 |
| 2018 | London (Heathrow) | 868 | 270 | 124 |
| 2018 | New York City (Central Park) | 1658 | 896 | 152 |
| 2019 | London (Heathrow) | 945 | 313 | 143 |
| 2019 | New York City (Central Park) | 1384 | 787 | 151 |
| 2020 | London (Heathrow) | 924 | 314 | 150 |
| 2020 | New York City (Central Park) | 1165 | 704 | 132 |
| 2021 | London (Heathrow) | 998 | 288 | 136 |
| 2021 | New York City (Central Park) | 1527 | 664 | 138 |
| 2022 | London (Heathrow) | 684 | 342 | 119 |
| 2022 | New York City (Central Park) | 1177 | 662 | 127 |
| 2023 | London (Heathrow) | 737 | 526 | 128 |
| 2023 | New York City (Central Park) | 1521 | 700 | 128 |
| 2024 | London (Heathrow) | 680 | 477 | 123 |
| 2024 | New York City (Central Park) | 1176 | 695 | 121 |
A “rainy hour or rainy day” uses the standard WMO threshold of > 0.254 mm (0.01 inch) of liquid-equivalent precipitation.
NYC leads on total rainfall and rainy hours across all ten years — more total rainfall and more rainy hours every single year. On rainy days London leads slightly at the standard 0.254 mm threshold (see the threshold sensitivity plot below). London’s high day counts come from frequent low-intensity events (< 0.254 mm) that account for negligible volume.
The figure below sweeps the threshold continuously (log scale, 0.01–5 mm) to confirm that NYC’s dominance on total volume and rainy hours is real. The rainy-days panel tells a more nuanced story: London leads at every threshold below ~1 mm (its many low-intensity events accumulate into more measurable days), NYC takes over above ~1 mm where individual event intensity matters more, with a brief London resurgence around 1.5 mm before NYC pulls clear.
Snow vs liquid rain (2015–2024)
The AA1 precipitation field records liquid-water equivalent for all
precipitation phases, so rain and snow both contribute to the depth column.
Snow and frozen-precipitation events are identified separately from the ISD
AW1/AW2/AW3 automated present-weather fields: any hour carrying a
condition code in the range 70–79 (continuous or intermittent snow, ice
pellets, diamond dust) or 83–89 (snow showers, mixed rain/snow, soft hail) is
flagged as a snow hour. A snow hour must also clear the 0.254 mm
measurable-precipitation threshold to be counted. A calendar day is a snow
day if it contains at least one snow hour; a liquid-rain day if it
contains liquid-rain hours and no snow hours at all (so mixed days are
counted only in snow days).
| Year | City | Rainy days | Snow days | Liquid-rain days | Snow hours | Liquid-rain hours |
|---|---|---|---|---|---|---|
| 2015 | London (Heathrow) | 136 | 1 | 135 | 1 | 277 |
| 2015 | New York City (Central Park) | 114 | 20 | 94 | 93 | 505 |
| 2016 | London (Heathrow) | 128 | 4 | 124 | 4 | 269 |
| 2016 | New York City (Central Park) | 117 | 12 | 105 | 65 | 491 |
| 2017 | London (Heathrow) | 132 | 3 | 129 | 3 | 265 |
| 2017 | New York City (Central Park) | 130 | 15 | 115 | 76 | 563 |
| 2018 | London (Heathrow) | 124 | 1 | 123 | 1 | 269 |
| 2018 | New York City (Central Park) | 152 | 17 | 135 | 90 | 806 |
| 2019 | London (Heathrow) | 143 | 2 | 141 | 2 | 311 |
| 2019 | New York City (Central Park) | 151 | 14 | 137 | 62 | 725 |
| 2020 | London (Heathrow) | 150 | 1 | 149 | 1 | 313 |
| 2020 | New York City (Central Park) | 132 | 7 | 125 | 31 | 673 |
| 2021 | London (Heathrow) | 136 | 1 | 135 | 1 | 287 |
| 2021 | New York City (Central Park) | 138 | 15 | 123 | 75 | 589 |
| 2022 | London (Heathrow) | 119 | 0 | 119 | 0 | 342 |
| 2022 | New York City (Central Park) | 127 | 9 | 118 | 59 | 603 |
| 2023 | London (Heathrow) | 128 | 1 | 127 | 1 | 525 |
| 2023 | New York City (Central Park) | 128 | 6 | 122 | 18 | 682 |
| 2024 | London (Heathrow) | 123 | 0 | 123 | 0 | 477 |
| 2024 | New York City (Central Park) | 121 | 10 | 111 | 50 | 645 |
| Mean | London (Heathrow) | 132 | 1.4 | 130.5 | 1 | 334 |
| Mean | New York City (Central Park) | 131 | 12.5 | 118.5 | 62 | 628 |
Key findings:
- NYC gets roughly 9× more snow days than London (avg 12.5 vs 1.4/yr). London’s two snowiest years in this period were 2016 and 2017 (4 and 3 snow days respectively); NYC’s quietest was 2023 (6 days, a very mild winter).
- Snow hours are ~60× more frequent in NYC (avg 62 vs 1 hr/yr). The large ratio relative to snow days reflects NYC’s heavier snowfall events — a single nor’easter (e.g. Blizzard Jonas January 2016, Winter Storm Stella March 2017) can account for 20–40 snow hours in a single multi-day event.
- London gets more liquid-rain days than NYC when snow days are set aside (avg 130.5 vs 118.5/yr), consistent with its higher frequency of low-intensity drizzle events noted in the precipitation section above.
- NYC’s liquid-rain hours still far exceed London’s (avg 628 vs 334/yr), confirming that NYC’s dominance in total hourly precipitation is driven by liquid rain, not snow.
- London had zero measurable snow hours in both 2022 and 2024 — years that did not produce a single AW1-coded frozen-precipitation event above the 0.254 mm threshold at Heathrow.
Temperature (2015–2024)
Temperature is taken from the ISD TMP field (see Methodology).
All metrics are normalised by observation count so that the two stations’
different reporting densities (London ≈ 24 obs/day on FM-12, NYC ≈ 12–18 on
FM-15) do not distort the comparison.
| Year | City | HDD (°C/obs) | CDD (°C/obs) | Comfort dev (°C) | <0 °C hours |
|---|---|---|---|---|---|
| 2015 | London (Heathrow) | 4.42 | 0.34 | 9.35 | 85 |
| 2015 | New York City (Central Park) | 5.43 | 2.44 | 10.15 | 1085 |
| 2016 | London (Heathrow) | 4.90 | 0.54 | 9.70 | 128 |
| 2016 | New York City (Central Park) | 5.01 | 2.32 | 9.77 | 638 |
| 2017 | London (Heathrow) | 4.59 | 0.52 | 9.42 | 170 |
| 2017 | New York City (Central Park) | 5.16 | 2.04 | 9.69 | 761 |
| 2018 | London (Heathrow) | 4.80 | 0.90 | 9.55 | 183 |
| 2018 | New York City (Central Park) | 5.63 | 2.24 | 10.30 | 676 |
| 2019 | London (Heathrow) | 4.72 | 0.62 | 9.54 | 82 |
| 2019 | New York City (Central Park) | 5.48 | 2.03 | 10.09 | 764 |
| 2020 | London (Heathrow) | 4.50 | 0.71 | 9.33 | 54 |
| 2020 | New York City (Central Park) | 4.69 | 2.07 | 9.35 | 401 |
| 2021 | London (Heathrow) | 5.02 | 0.47 | 9.89 | 175 |
| 2021 | New York City (Central Park) | 4.93 | 2.13 | 9.47 | 584 |
| 2022 | London (Heathrow) | 4.33 | 0.80 | 9.09 | 199 |
| 2022 | New York City (Central Park) | 5.29 | 2.18 | 9.98 | 879 |
| 2023 | London (Heathrow) | 4.46 | 0.60 | 9.20 | 181 |
| 2023 | New York City (Central Park) | 4.23 | 1.96 | 8.78 | 179 |
| 2024 | London (Heathrow) | 4.07 | 0.51 | 8.85 | 74 |
| 2024 | New York City (Central Park) | 4.57 | 2.15 | 9.10 | 484 |
- HDD = mean °C below 15.5 °C per observation (heating pressure). Both cities are roughly equal — London is slightly colder most years but the gap is small (< 1 °C/obs).
- CDD = mean °C above 18 °C per observation (cooling pressure). NYC runs 3–4× higher than London every single year. NYC summers are genuinely hot; London rarely sustains temperatures above 18 °C for long.
- < 0 °C hours makes NYC’s cold winters visible. NYC regularly freezes for 400–1100 hours a year; London typically logs 75–200. The HDD metric alone understated this because NYC’s hot summers partially cancel its winter cold when averaged over the full year.
The figure below shows the full hourly temperature distributions alongside the mean absolute deviation from any chosen reference temperature. London’s histogram is narrowly Gaussian around 10–11 °C; NYC’s is flatter and wider, and its deviation curve sits higher across the board — reflecting a more continental climate with hotter summers and colder winters.
Long-term trends (2005–2024)
NYC Central Park station data is available in the NOAA ISD from 2005 onwards.
Prior to ~2012, the ISD labels these records as AUTO rather than FM-15;
the format and hourly frequency are identical (ASOS :51 timestamps), and the
data are included here after validation against GHCND totals. The figure below
shows six annual metrics on a shared year axis. Each city’s annual value is
plotted as a semi-transparent line with dots; the thick line is a 5-year
centred rolling mean (±1 std shaded) to reveal any secular drift.
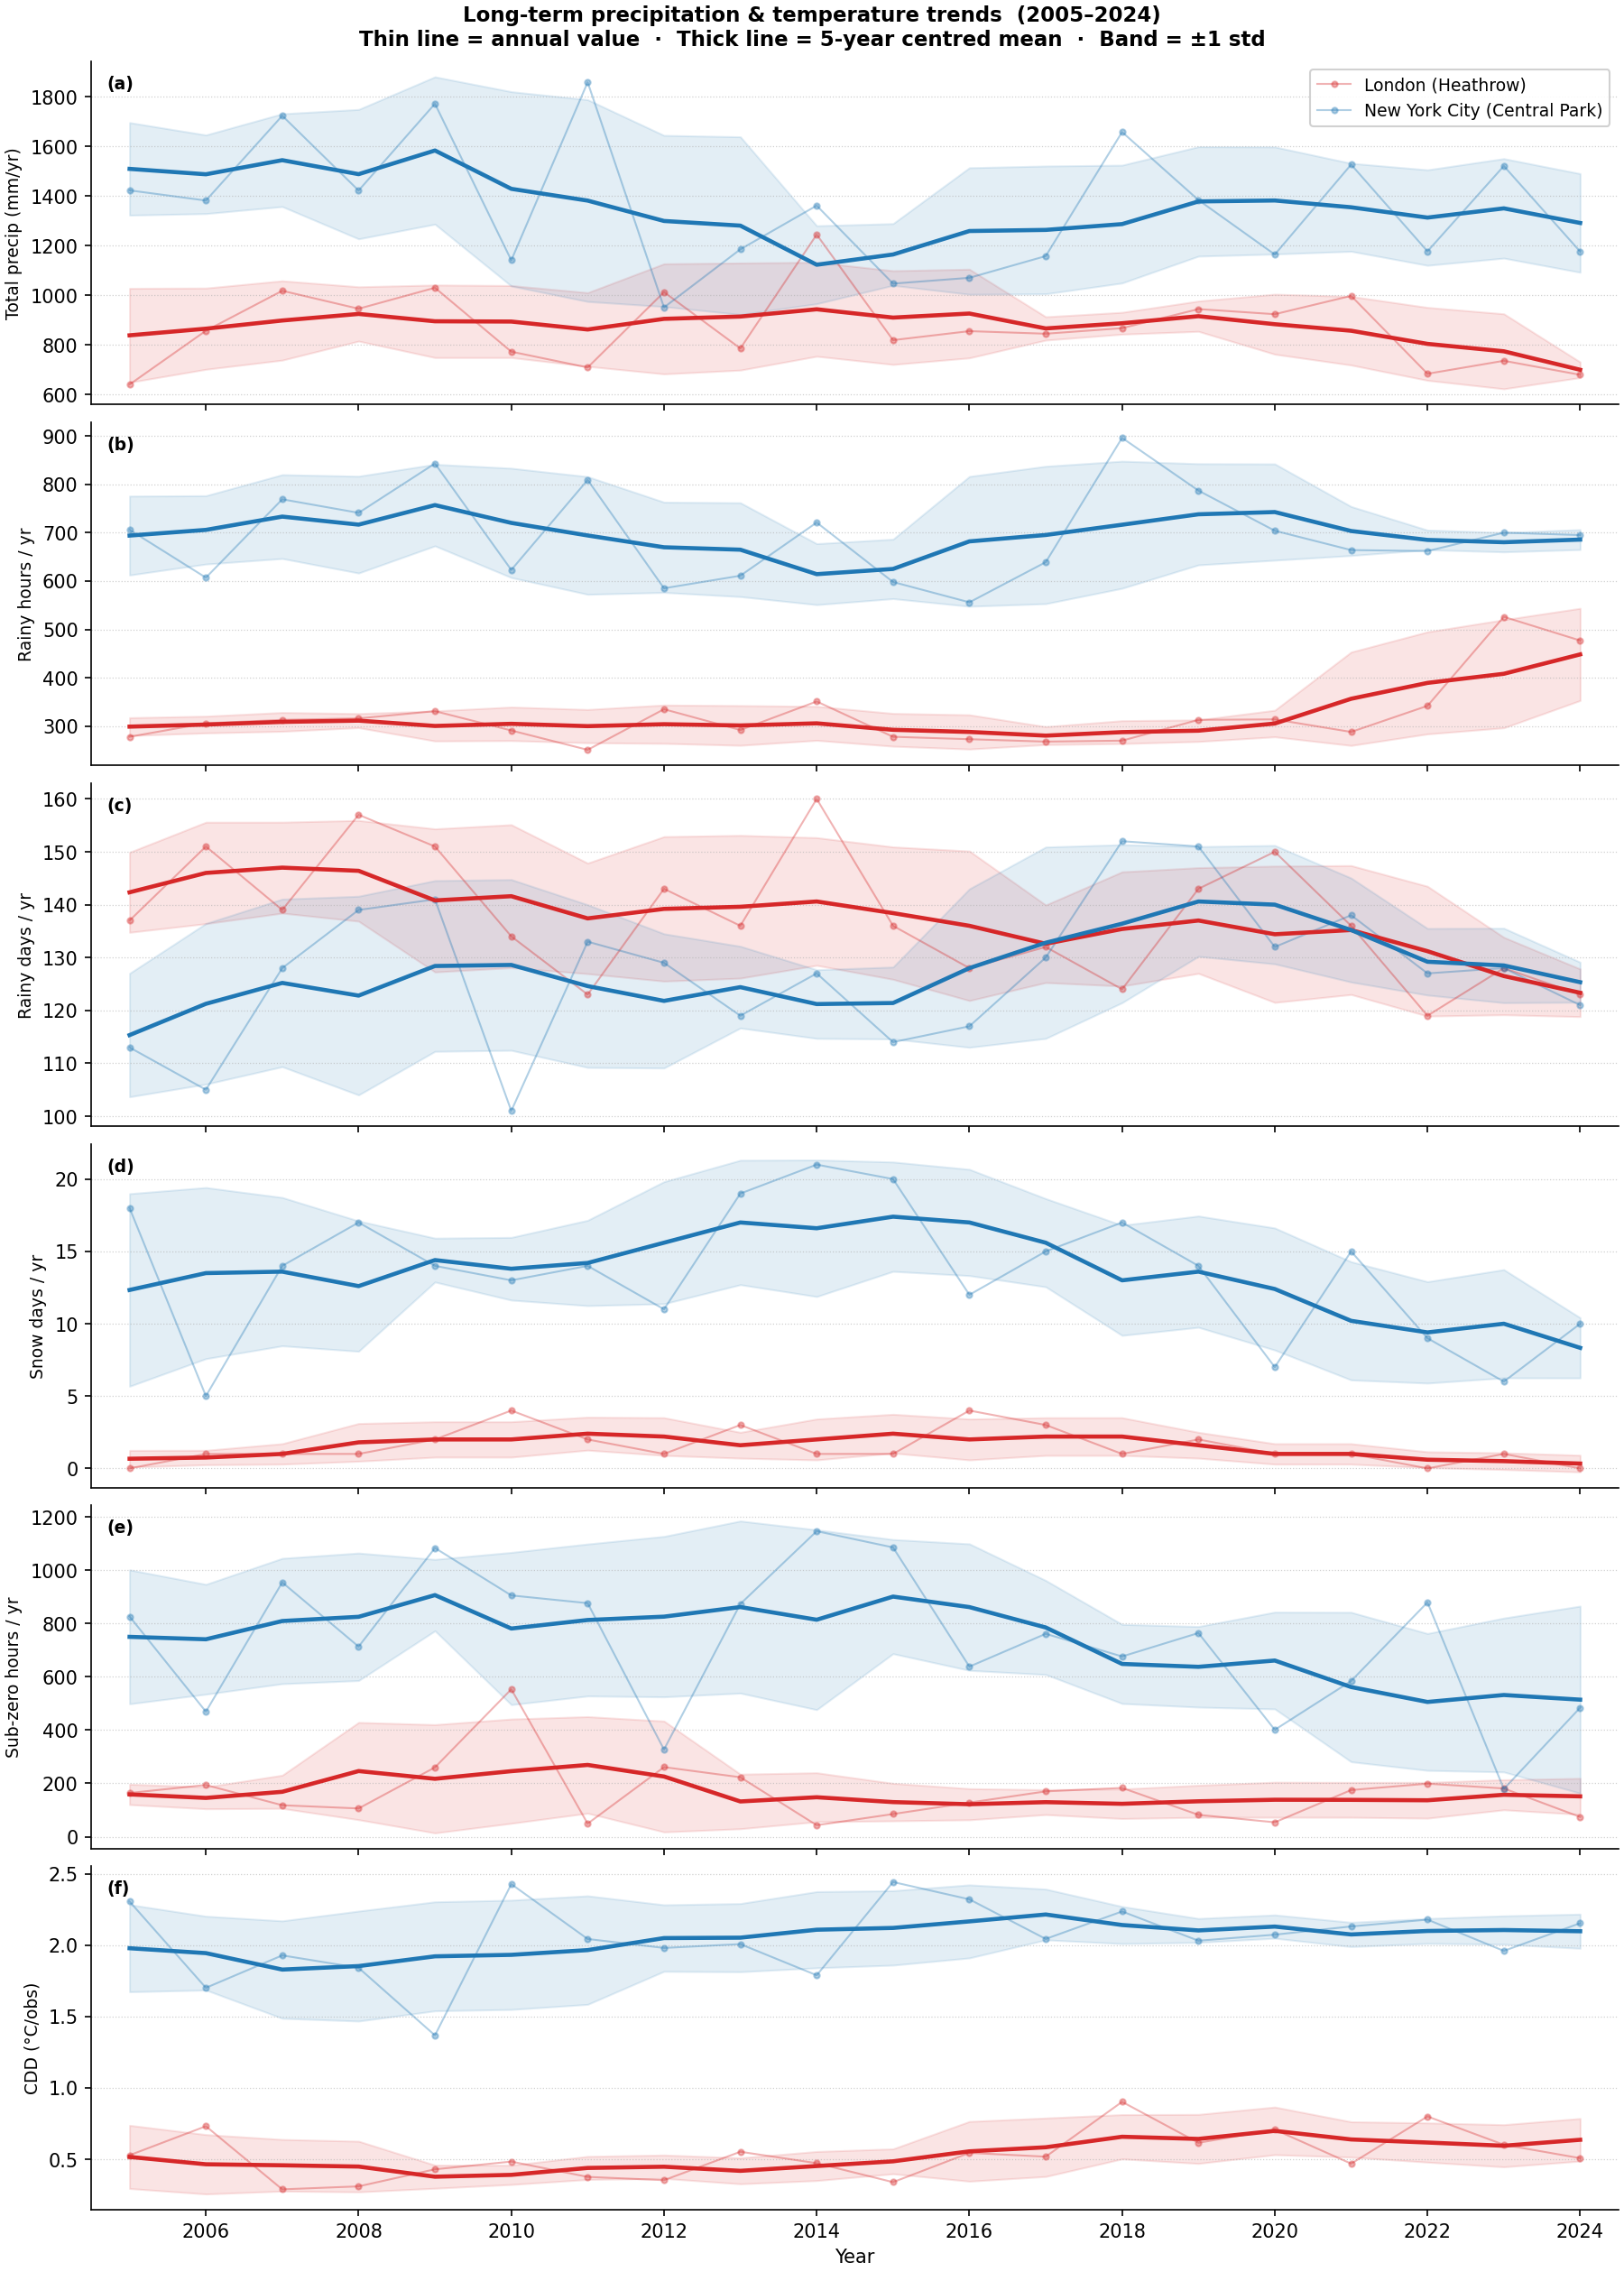
Observations from the 20-year record:
- No significant trend in total precipitation for either city. Both London’s and NYC’s rolling means are essentially flat across 2005–2024, with large year-to-year variability swamping any signal. NYC’s mean sits ~400–600 mm above London’s throughout the entire period.
- NYC rainy-hours count is higher every single year and shows no narrowing of the gap over time. London’s count has drifted upward since ~2020 (driven by the switch to higher-frequency FM-15 supplemental reporting at Heathrow) — this is a data artefact, not a real climate signal; the total precipitation (panel a) shows no corresponding increase.
- Snow days (panel d) confirm no long-term trend in either city. NYC averages 12–15 snow days/yr in the 2000s and 2010s, dipping to 6–10 in the early 2020s; London’s record remains flat at 0–4 days throughout.
- Sub-zero hours (panel e) show NYC becoming slightly milder over the period — the 5-year mean fell from ~800–1100 hrs/yr in 2005–2015 to ~400–600 hrs/yr in 2020–2024 — consistent with the broader US trend of warming winters. London’s sub-zero hours are stable at 50–200 hrs/yr.
- CDD (panel f) is rising for both cities, most visibly for London where the rolling mean has climbed from ~0.3 to ~0.7 °C/obs over the 20 years, consistent with European summer warming trends. NYC’s CDD is higher and noisier but also trends upward from ~1.0–1.5 to ~2.0–2.5 °C/obs.
Why the stereotype persists
London has noticeably more overcast, grey days than NYC. When a looser
threshold (any non-zero AA1 depth) is applied, London scores more rainy days
(154–184 vs 121–138) because its FM-12 SYNOP reports frequently log sub-trace
accumulations of 0.1–0.2 mm drizzle. NYC’s METAR observations encode
equivalent events as condition=2 (trace) with depth=0, which disappears
under any positive threshold. The 0.254 mm threshold eliminates this
reporting asymmetry.
Installation
Requires Python ≥ 3.9.
python -m venv .venv
source .venv/bin/activate
pip install -e .
Usage
python -m lon_nyc [--start YEAR] [--end YEAR] [--plot FILE] [--temp-plot FILE] [--snow-plot FILE] [--trend-plot FILE]
Or, if installed via pip install -e .:
lon-nyc [--start YEAR] [--end YEAR] [--plot FILE] [--temp-plot FILE] [--snow-plot FILE] [--trend-plot FILE]
| Argument | Default | Description |
|---|---|---|
--start |
2020 |
First year to fetch (inclusive) |
--end |
2025 |
Last year to fetch (inclusive) |
--plot FILE |
(none) | Save a rainfall threshold-sensitivity plot to FILE (PNG) |
--temp-plot FILE |
(none) | Save a temperature histogram + deviation plot to FILE (PNG) |
--snow-plot FILE |
(none) | Save a snow vs liquid-rain 2×2 stacked-bar figure to FILE (PNG) |
--trend-plot FILE |
(none) | Save a multi-panel long-term trends figure (5-yr rolling mean) to FILE (PNG) |
--no-cache |
(off) | Disable on-disk CSV cache (re-downloads from S3) |
Example
python -m lon_nyc --start 2005 --end 2024 \
    --plot plots/threshold_sensitivity.png \
    --temp-plot plots/temperature_panels.png \
    --snow-plot plots/snow_vs_rain.png \
    --trend-plot plots/long_term_trends.png
Sample output:
================================Annual Precipitation Summary================================
Years 2005–2024 | threshold: >0.254 mm

Year   City                             Total (mm)  Rainy hrs  Rainy days  Snow hrs  Snow days  Rain hrs  Rain days
--------------------------------------------------------------------------------------------------------------------
2005   London (Heathrow)                     641.2        278         137         0          0       278        137
2005   New York City (Central Park)         1422.8        706         113        74         18       632         95
...

==============================Annual Temperature Summary==============================
Years 2015–2024 | HDD base: 15.5°C  CDD base: 18.0°C  Comfort base: 21.0°C

Year   City                              HDD (°C/obs)  CDD (°C/obs)  Comfort dev  <0°C hrs
-------------------------------------------------------------------------------------------
2015   London (Heathrow)                         4.42          0.34         9.35        85
2015   New York City (Central Park)              5.43          2.44        10.15      1085
...
Methodology
Stations
| City | Station | USAF | WBAN | WMO | Report type |
|---|---|---|---|---|---|
| New York City (Central Park) | 725053-94728 |
725053 | 94728 | — | FM-15 (METAR) |
| London (Heathrow, EGLL) | 037720-99999 |
037720 | 99999* | 03772 | FM-12 (SYNOP) |
* UK stations have no WBAN code; 99999 is the standard ISD placeholder.
S3 object keys strip the hyphen from the station ID, e.g.
noaa-global-hourly-pds/2023/72505394728.csv.
Precipitation field
Precipitation depth is taken from the ISD AA1 compound field:
AA1 = period_hours , depth_tenths_mm , condition_code , quality_code
The depth (second sub-field, index 1) is an integer in tenths of
millimetres, converted to mm by dividing by 10. Missing observations are
coded 9999 or +9999 and become NaN.
AA1 always reports liquid-water equivalent regardless of precipitation
phase, so rain, snow, sleet, and freezing rain all contribute to the same
depth column. Snow and frozen events appear as positive depths in AA1 at the
same liquid-equivalent rate — there is no snow/rain asymmetry between the two
cities in the depth field.
Snow / frozen-precipitation detection
Precipitation phase is determined from the ISD automated present-weather fields
AW1, AW2, and AW3. Each field encodes a single weather phenomenon as
condition_code,quality_code. An observation hour is flagged as frozen
precipitation when any of the available AWn columns carries a code from the
following ranges (ISD Section 7.1):
| Code range | Phenomenon |
|---|---|
| 70–75 | Continuous or intermittent snow (light → heavy) |
| 76–79 | Diamond dust, snow grains, ice crystals, ice pellets (sleet) |
| 83–84 | Moderate/heavy shower of mixed rain and snow |
| 85–86 | Light or moderate/heavy snow showers |
| 87–89 | Soft hail, ice pellet showers, small hail |
A row is a snow hour only when it also clears the 0.254 mm measurable- precipitation threshold. A day is a snow day if it contains at least one snow hour; a liquid-rain day if it has liquid-rain hours and no snow hours at all (mixed days are classified as snow days only).
| Code | Name | Kept? | Reason |
|---|---|---|---|
| FM-15 | METAR (hourly) | ✅ | Primary NYC observation type (2012–present); also present at Heathrow but used only as a fallback (see note below) |
| AUTO | ASOS automated obs (hourly) | ✅ | NYC label prior to ~2012; identical format and frequency to FM-15 |
| FM-12 | SYNOP (hourly) | ✅ | Primary London/Heathrow observation type |
| FM-16 | SPECI (special METAR) | ❌ | Sub-hourly; variable AA1 period causes double-counting |
| SOD/SOM | Daily/monthly summaries | ❌ | Not hourly |
Heathrow FM-12 vs FM-15 for temperature. Heathrow files both FM-12 (SYNOP) and FM-15 (METAR) reports, but the ISD stores temperature in the FM-15 rows at whole-degree Celsius resolution only (e.g.
+0100= 10 °C exactly), whereas FM-12 rows carry genuine 0.1 °C resolution. Using FM-15 rows would produce large artificial spikes at every integer °C in the temperature histogram. The processor therefore uses FM-12 rows exclusively for temperature whenever a station files any FM-12 reports, falling back to FM-15 / AUTO only for stations (like NYC) that have no FM-12 data at all. FM-15 and AUTO are treated as equivalent for this purpose — the presence of a few supplemental FM-15 rows in otherwise-AUTO years does not cause the AUTO rows to be dropped. This is done automatically — no station-specific configuration is needed. For precipitation, FM-12 rows are used for Heathrow because theAA1accumulation field is only populated there on FM-12 rows; NYC’sAA1data is on FM-15 / AUTO rows. Both types are parsed and the results combined.
Rainy-hour threshold
An hour is counted as rainy when precipitation_mm > 0.254 mm
(equivalent to the US NWS / WMO definition of 0.01 inch of measurable
precipitation).
Using > 0 mm instead inflates London’s counts because Heathrow’s FM-12
SYNOP reports frequently log sub-trace accumulations (0.1–0.2 mm drizzle)
that NYC’s FM-15 METARs encode as condition=2 / depth=0 (trace).
The 0.254 mm threshold eliminates this reporting asymmetry and aligns both
cities with published climate-table conventions.
Rainy-day definition
A calendar day is rainy if it contains at least one rainy hour (i.e. at least one hour with liquid-equivalent depth > 0.254 mm). Rainy days decompose into snow days (at least one snow hour that day) and liquid-rain days (one or more liquid-rain hours, no snow hours); the two categories are mutually exclusive so they sum to the total rainy-day count.
Temperature discomfort
Hourly air temperature is taken from the ISD TMP mandatory field:
TMP = +TTTT , Q
TTTT is temperature in tenths of °C (signed integer); Q is a quality
flag. Two categories of observation are excluded as NaN:
- Missing sentinel —
+9999/9999. - Bad quality flags — codes
2(suspect),3(erroneous),6(suspect by element-consistency check),7(erroneous by element-consistency check), and9(missing). Codes0,1,4,5are accepted.
As noted in the report-type section above, Heathrow FM-12 rows are used exclusively for temperature (0.1 °C resolution); FM-15 rows are dropped for this station to avoid whole-degree histogram spikes.
Three metrics are computed, each using its own conventional baseline, and all normalised by observation count to make the two stations comparable:
| Metric | Formula | Baseline | Standard |
|---|---|---|---|
| HDD | mean(max(15.5 − T, 0)) | 15.5 °C | WMO / UK Met Office heating degree-day base |
| CDD | mean(max(T − 18, 0)) | 18.0 °C | Standard cooling degree-day base |
| Comfort dev | mean(|T − 21|) | 21.0 °C | Two-sided deviation from a comfortable temperature |
| < 0 °C hours | count(T < 0) | 0 °C | Raw count of freezing hours per year |
Using separate baselines for HDD and CDD (rather than one combined baseline) ensures each metric measures what it is conventionally understood to measure.
Validation against GHCND (NYC)
Annual totals from the ISD AA1 field were cross-checked against
GHCND
daily totals for Central Park (station USW00094728).
Agreement is within ~1% across all years.
| Year | GHCND official | Our ISD calc | Difference |
|---|---|---|---|
| 2020 | 1151.9 mm (45.35 in) | 1166.0 mm | +1.2% |
| 2021 | 1517.1 mm (59.73 in) | 1527.3 mm | +0.7% |
| 2022 | 1176.0 mm (46.30 in) | 1185.7 mm | +0.8% |
| 2023 | 1506.0 mm (59.29 in) | 1523.3 mm | +1.2% |
| 2024 | 1177.8 mm (46.37 in) | 1178.0 mm | +0.0% |
The small systematic ~+1% occurs because GHCND records trace (T)
precipitation as exactly zero, whereas the ISD AA1 field sometimes
encodes a small positive depth for the same events.
Running the tests
pip install -e ".[dev]"
pytest
Planned: sunshine hours comparison
The natural follow-up question is whether London has more sunshine than NYC — the other half of the “miserable London weather” stereotype.
London
Real observed hourly sunshine data (Campbell-Stokes recorder) is available from the Met Office MIDAS Open dataset via CEDA:
- Station: Heathrow (
src_id708), fieldsun_dur_mins - Authentication: free CEDA account → bearer token via
POST https://services.ceda.ac.uk/api/token/create/
NYC
No equivalent observed sunshine record exists in any public US network. The following sources were investigated:
| Source | Outcome |
|---|---|
GHCND TSUN — Central Park, JFK, LaGuardia |
0 / 365 days populated in 2020–2024 |
NOAA LCD HourlySkyConditions |
Cloud-layer codes only; no duration |
ISD GF1 sky-cover oktas |
Invalid proxy — counts night-time clear sky |
ISD REM 55SSS SYNOP groups — Central Park / JFK / LaGuardia |
Sparse and unreliable |
ISD REM 55SSS SYNOP groups — Newark EWR (725020-14734) |
Investigated in detail below; not usable |
| NOAA SURFRAD / SolRad-Net pyranometer networks | Nearest station is Penn State, PA (≈ 250 km); no NYC-area site |
| NOAA US Climate Reference Network (USCRN) | No station within NYC or close suburbs |
NASA AERONET — CCNY (40.82°N, 73.95°W) and GISS (40.80°N, 73.96°W) |
Cimel direct-sun photometers only observe when the sun is unobscured, so obs presence ≠ cloud-free sky; additionally Level 1.5 data are cloud-screened (cloudy obs removed), gaps cannot be distinguished from instrument downtime (e.g. a 6-day outage Jun 18–24 2023), and the SZA cutoff (≈ 78°) causes systematic undercounting of ~2–3 h/day near sunrise/sunset |
NOAA 1961–1990 climate normals (TSUN) — Central Park |
Monthly normals exist (≈ 2 535 hrs/yr) but the underlying sunshine recorder was discontinued; no equivalent hourly series for 2020–2024 |
| Open-Meteo ERA5 reanalysis | Modelled, not observed; inflates ≈ 60 % vs Met Office actuals |
Newark EWR investigation
Newark Liberty International Airport (725020-14734) is the closest major
weather station to NYC that files SYNOP (FM-12) reports in the ISD, and was
investigated as a possible sunshine-recorder proxy. The ISD REM field was
parsed for WMO SYNOP 55SSS groups (sunshine duration in tenths of hours since
the last observation) across 2020–2024, excluding sentinel values ≥ 300.
| Year | Newark SYN rows | Real 55SSS obs |
Implied sunshine hrs | Avg hr/day |
|---|---|---|---|---|
| 2020 | 1 450 | 96 | 51 | 0.1 |
| 2021 | 1 436 | 89 | 39 | 0.1 |
| 2022 | 1 449 | 101 | 44 | 0.1 |
| 2023 | 1 655 | 102 | 46 | 0.1 |
| 2024 | 2 775 | 219 | 101 | 0.3 |
For comparison, Heathrow logs 634–941 real 55SSS observations per year and
implies 1 250–1 680 sunshine hours annually (≈ 3.4–4.6 hr/day) — physically
plausible for a Campbell-Stokes recorder. Newark’s implied totals of
39–101 hours per year (≈ 0.1 hr/day) are physically impossible and confirm
that Newark does not operate a sunshine-duration recorder. The sparse
55SSS groups that do appear are opportunistic entries in manually augmented
SYNOP messages, not systematic instrument readings.
Conclusion: No observed sunshine-duration series for NYC is available for 2020–2024 in any public network. US ASOS/AWOS stations do not deploy sunshine-duration recorders, and the radiation monitoring networks (SURFRAD, SolRad-Net, USCRN) have no NYC-area site. The AERONET instruments at CCNY and GISS are in principle a sunshine proxy (they only observe when the sun is unobscured) but are not usable in practice: the Level 1.5 cloud-screened dataset removes cloudy observations, making gaps indistinguishable from instrument downtime (a 6-day outage was confirmed in June 2023), and the solar zenith angle cutoff (≈ 78°) causes systematic undercounting of 2–3 hours of daylight near sunrise and sunset. Historical NOAA normals show ≈ 2 535 sunshine hours/yr for Central Park in the 1961–1990 period, but the underlying instrument record has not been continued. Implementation is deferred until an equivalent NYC observed-sunshine source is identified.
Wikipedia climate-normal comparison
Even though a contemporary observed series for NYC is unavailable, the
Wikipedia long-term normals allow a static city-to-city comparison. The
Heathrow 2015–2024 observed mean (derived from ISD 55SSS groups, see
scripts/heathrow_sunshine.py) can be compared against both its own
1991–2020 Met Office normal and the NOAA 1961–1990 Central Park normal.
| Month | LHR obs 2015–24 (h) | LHR wiki 1991–2020 (h) | NYC wiki 1961–90 (h) | NYC − LHR (h) |
|---|---|---|---|---|
| Jan | 72.0 | 57.5 | 162.7 | +105.2 |
| Feb | 82.5 | 77.8 | 163.1 | +85.3 |
| Mar | 112.0 | 111.5 | 212.5 | +100.5 |
| Apr | 158.3 | 157.3 | 225.6 | +67.3 |
| May | 180.8 | 192.0 | 256.6 | +75.8 |
| Jun | 187.4 | 196.4 | 257.3 | +69.9 |
| Jul | 185.3 | 203.3 | 268.2 | +82.9 |
| Aug | 162.9 | 196.8 | 268.2 | +105.3 |
| Sep | 130.4 | 144.7 | 219.3 | +88.9 |
| Oct | 99.7 | 100.9 | 211.2 | +111.5 |
| Nov | 71.5 | 62.8 | 151.0 | +79.5 |
| Dec | 57.4 | 44.6 | 139.0 | +81.6 |
| Annual | 1 500 | 1 546 | 2 535 | +989 |
Sources: NYC — NOAA 1961–1990 normals via
Wikipedia.
LHR wiki — Met Office 1991–2020 normals via
Wikipedia.
LHR obs — computed from NOAA ISD 55SSS groups (this project,
scripts/heathrow_sunshine.py).
Key finding: NYC receives roughly +990 hours more sunshine per year than London Heathrow — about 64 % more (2 535 h vs 1 546 h). The gap is largest in autumn and winter (Oct +112 h, Jan +105 h, Aug +105 h) and smallest in late spring/early summer (Apr +67 h, Jun +70 h), when London’s long days partially compensate for its cloudier skies. The Heathrow 2015–2024 observed mean (1 500 h) is close to the 1991–2020 normal (1 546 h), giving confidence that the ISD-derived series is well-calibrated.
Note: the baseline periods differ (1961–1990 for NYC, 1991–2020 for LHR), so the comparison is indicative rather than strictly contemporaneous.
Daylight seasonality: latitude effect on usable daylight
Motivation
London sits at 51.5°N and New York City at 40.7°N — a difference of nearly 11 degrees of latitude. That gap drives a dramatic difference in day length seasonality. London’s summer days are very long (≈ 16.4 h near the June solstice) while its winter days are very short (≈ 7.6 h near the December solstice). NYC is more moderate in both directions (≈ 14.9 h in June, ≈ 9.1 h in December).
The key question is: how much of that daylight is actually usable, given that early-morning light before you wake up and late-evening light after bedtime is largely wasted?
Method
The analysis uses the standard WMO sunrise equation (see
scripts/daylight_latitude.py):
δ = −23.45° × cos(360/365 × (doy + 10))
cos(ω₀) = −tan(φ) × tan(δ)
day_length = 2ω₀ / 15   (hours)
where doy is day-of-year and φ is latitude. Sunrise and sunset are expressed in local solar time, which is a good proxy for clock time at these longitudes (London ≈ 0°W, NYC ≈ 74°W with UTC−5 standard time). Daylight Saving Time is not applied; DST shifts both cities’ clocks equally.
Usable daylight is the overlap of [sunrise, sunset] with the waking window, averaged over all 365 days of the year.
Effect of sleep schedule
Rather than fix a single waking window, scripts/sleep_schedule_daylight.py
sweeps the wake-up time across the full 24-hour clock in 15-minute steps,
assuming a fixed 8-hour sleep window (so 16 waking hours). For each
wake-up time, usable daylight is the overlap of the 16-hour waking window with
[sunrise, sunset], averaged over all 365 days.
London (red) vs NYC (blue) — annual-mean usable daylight by wake-up time:
Key findings
-
For typical sleep schedules (wake 06:00–12:00), the difference is negligible. NYC leads by at most ~0.2 h/day — barely 12 minutes. Waking anywhere between 08:00 and noon gives almost identical usable daylight in both cities.
-
Early risers get slightly more in NYC. London’s extreme winter shortfall (December days of only 7.7 h) is not compensated by its long summer mornings, which mostly fall before any reasonable wake time. NYC’s more moderate year-round day length gives it a small consistent edge for normal schedules.
-
Night owls get more daylight in London. For wake times of roughly 12:00–20:00 (sleeping through the morning), London’s very long summer evenings pay off. The London advantage peaks at +0.22 h/day when waking at 14:00 — the only scenario where London’s latitude is genuinely beneficial for usable daylight.
-
London’s daylight is 1.5× more seasonal. The standard deviation of daily day length is 3.0 h/day in London vs 2.0 h/day in NYC. London’s extreme seasonality amplifies both directions, but the waking-window clips only the top (early-morning summer hours), not the bottom (short winter days) — producing a net annual deficit for most schedules.
Scripts: scripts/daylight_latitude.py and scripts/sleep_schedule_daylight.py
(no external data required — purely astronomical).
Air quality comparison (2015–2024)
Motivation
Both London and NYC have improved dramatically since the mid-20th century (London’s coal-smog era, NYC’s pre-Clean-Air-Act industrial pollution), but the two cities still face very different acute air quality threats. NYC sits downwind of the boreal forests of Canada and experiences periodic wildfire smoke events — most dramatically in June 2023 when Canadian wildfires drove NYC PM2.5 to ~40 µg/m³ on a monthly average, and briefly to hazardous levels on individual days. London, further east with the Atlantic upwind, was completely unaffected.
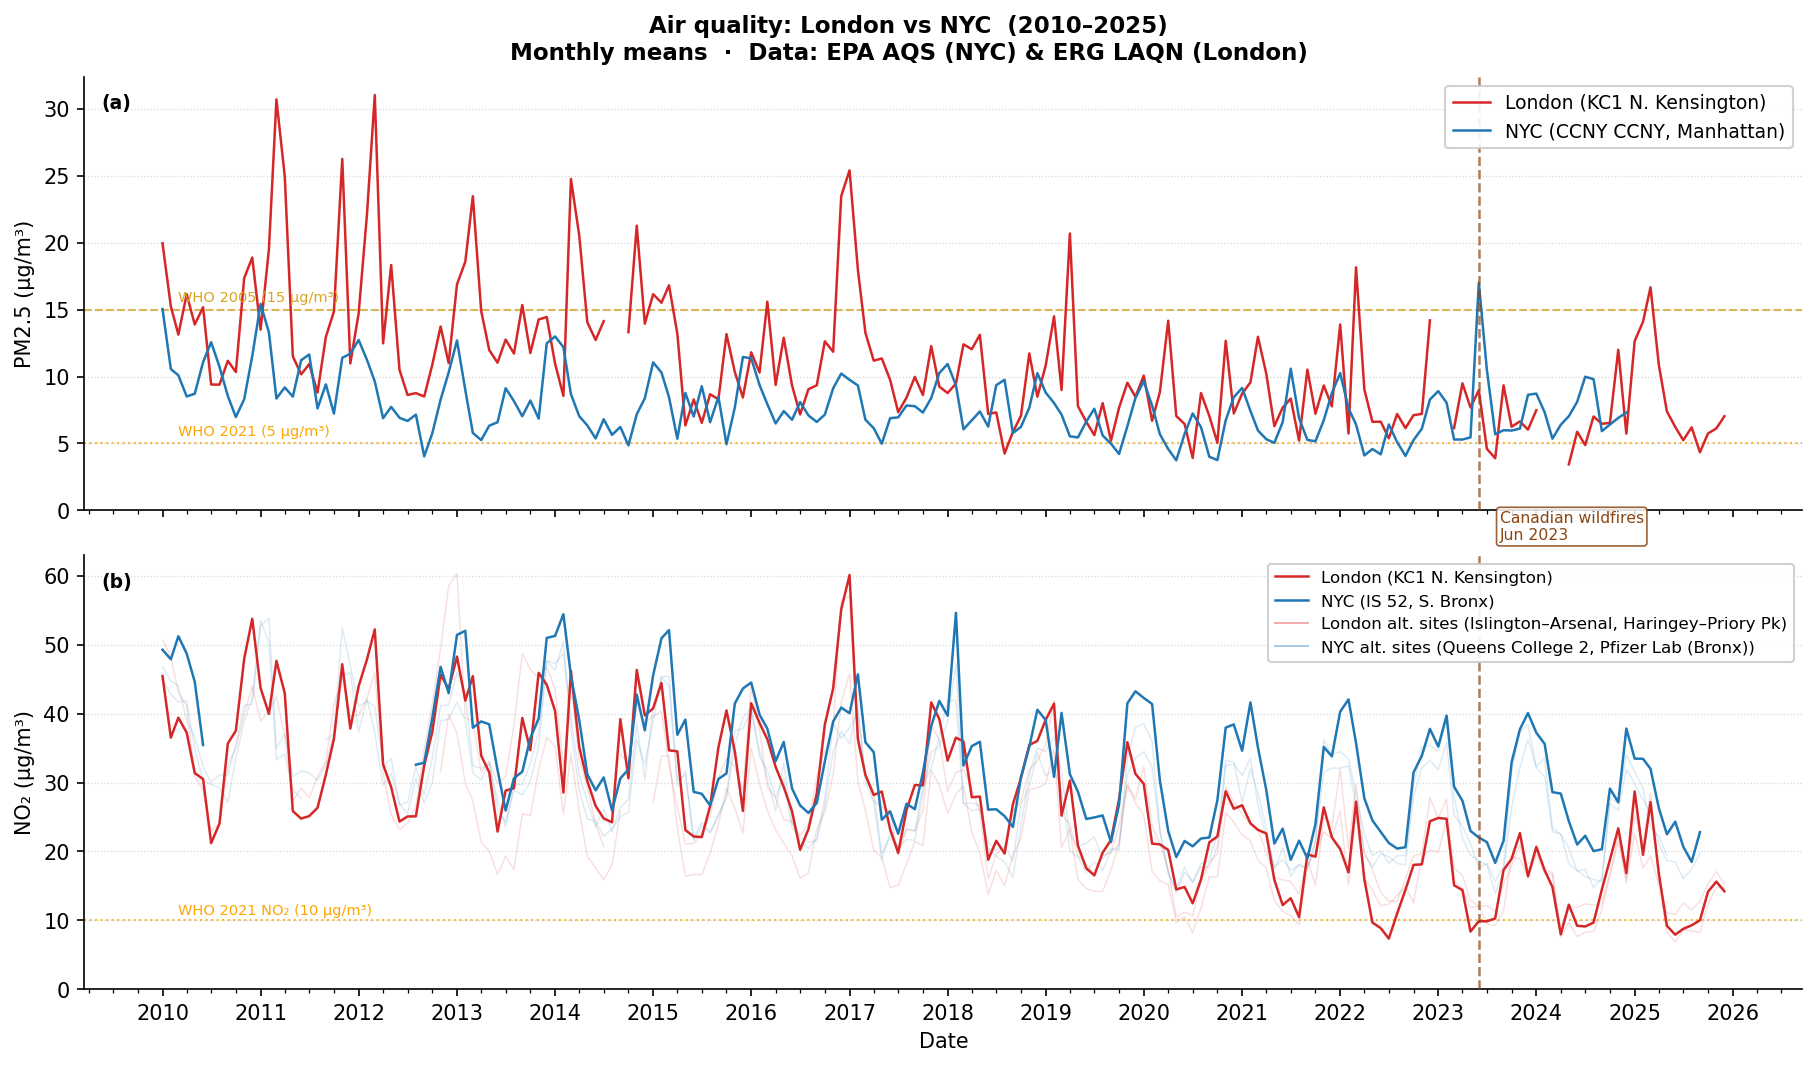
Monthly mean PM2.5 (top) and NO2 (bottom), 2015–2024. Thin lines show raw monthly values; thick lines show a 3-month rolling mean. WHO annual guidelines are shown as dashed (2005 standard) and dotted (2021 revised standard) horizontal lines.
Why not compare AQI to DAQI?
AQI and DAQI are not directly comparable — they have completely different breakpoints and scales (AQI 0–500; DAQI 1–10), each calibrated against their own national standards (US NAAQS vs UK AQS). The correct shared unit is concentration in µg/m³, which both networks measure physically. NO2 from the US EPA network is reported in ppb and converted here using the standard factor of 1.88 µg/m³ per ppb (at 20 °C / 1 atm).
Monitor selection
Getting a genuinely comparable pair of sites took more work than expected. The two core requirements were: (a) the same LAQN/EPA site classification (“Urban Background” on both sides — not roadside, kerbside or industrial), and (b) a continuous instrument giving a reading every single day across the full 2015–2024 window.
NYC — what was considered and why each was rejected or kept
PM2.5 instrument type — FRM vs continuous
All sites in the standard EPA daily_88101 (FRM) archive use filter-based
gravimetric samplers. A filter cassette is exposed for exactly 24 hours, then
sent to a laboratory for weighing — but only every 1–6 days depending on the
monitoring schedule. IS 45 (the initial candidate) operates on a roughly
every-other-day schedule, yielding ~14–18 valid observations per month.
Monthly means computed from those samples are statistically valid, but the
timeseries looks visibly gappy when plotted.
The EPA publishes a separate archive, daily_88502, for continuous PM2.5
instruments (TEOM and BAM analysers that report every hour and roll up to
a 24-hour block average). These give one row per day, every day.
NYC PM2.5 sites surveyed (continuous, EPA 88502, 2015–2024):
| Site | Borough | Days/yr (typical) | Notes |
|---|---|---|---|
| CCNY | Manhattan (Washington Heights) | 363–366 | ✅ Chosen. Longest continuous PM2.5 record in Manhattan. Urban background character — college campus on a hilltop, away from any major road. Full 10-year record. |
| MORRISANIA | Bronx | 360–365 | Urban background, full record, but Bronx not Manhattan. |
| IS 74 | Staten Island | 355–365 | Urban background, but geographically isolated from the other boroughs. |
| FRESHKILLS WEST | Staten Island | 345–360 | Adjacent to a landfill — not representative urban background. |
| MASPETH LIBRARY | Queens | 358–365 | Queens community library — urban background, good record. |
| PS 314 / PS 274 | Brooklyn | 130–215 | Incomplete records, Brooklyn schools. |
| Intermediate School 143 | Bronx | 299–310 | Good record but Bronx, and IS 52 already covers the Bronx for NO2. |
CCNY (City College of New York, 160 Convent Ave, 40.819°N 73.948°W) was chosen: it is the only continuous PM2.5 site in Manhattan, sits on a hilltop campus in Washington Heights well away from major arterials, and has run without gaps since at least 2015.
NYC NO2 sites surveyed (EPA 42602, continuous, 2015–2024):
No Manhattan NO2 monitor exists anywhere in the EPA network. The available sites with a full 10-year continuous record are all in the Bronx or Queens:
| Site | Borough | Lat | Lon | Distance from CCNY | Mean NO2 2023 (µg/m³) | Notes |
|---|---|---|---|---|---|---|
| IS 52 | Bronx | 40.816 | −73.902 | 3.5 km | 29 | ✅ Chosen. Closest site to CCNY, same urban-background residential character. |
| PFIZER LAB SITE | Bronx | 40.868 | −73.878 | 9 km | 26 | Historically co-located with an industrial facility — less representative. |
| QUEENS COLLEGE 2 | Queens | 40.736 | −73.822 | 11 km | 26 | College campus, good record, but 11 km from CCNY and in a different borough. |
| Queens College Near Road | Queens | 40.736 | −73.822 | 11 km | — | Explicitly designated “Near Road” — roadside, not urban background. Excluded. |
IS 52 (South Bronx, 40.816°N 73.902°W) is a school-based monitor 3.5 km from CCNY across the Harlem River — essentially the same neighbourhood. Its 2023 mean NO2 of 29 µg/m³ is consistent with other urban-background Bronx and Queens sites, and it has no gaps in the 2015–2024 record.
London — what was considered and why each was rejected or kept
The London LAQN has 258 active and historical monitoring sites across Greater London. The ERG API exposes all of them. The initial choice, BL0 Camden–Bloomsbury, is one of the longest-running urban-background sites in the network (since 1992) but was found to have serious data problems for PM2.5:
BL0 Camden–Bloomsbury PM2.5 data availability by period:
| Period | Status |
|---|---|
| 2015 – May 2021 | ✅ Good (600–720 hourly values/month) |
| Jun 2021 – Apr 2022 | ❌ Complete gap — instrument offline for 11 months |
| May 2022 – Aug 2023 | ✅ Good |
| Sep 2023 – Dec 2024 | ❌ No data |
BL0 NO2 is fine throughout; the gap is specific to the PM2.5 instrument. Using BL0 would require either gap-filling or truncating the London PM2.5 series at mid-2023 — neither is satisfactory for a 10-year comparison.
London urban-background sites checked for 2015–2024 continuity:
| Site | Type | PM2.5 2024? | NO2 2024? | Notes |
|---|---|---|---|---|
| BL0 Camden–Bloomsbury | Urban Background | ❌ (stopped Aug 2023) | ✅ | 11-month PM2.5 gap in 2021–22. Rejected for PM2.5. |
| KC1 N. Kensington | Urban Background | ✅ | ✅ | ✅ Chosen. Continuous PM2.5 and NO2 throughout 2015–2024. Open since 1995. |
| HK6 Hackney – Old Street | Roadside | ✅ | ✅ | Roadside classification — not urban background. Excluded. |
| LW2 Lewisham – New Cross | Roadside | ✅ | ✅ | Roadside. Closed Apr 2025. Excluded. |
| CT3 City of London – Aldgate | Urban Background | ❌ | ✅ | Closed Jun 2023. Excluded. |
| MY1 Westminster – Marylebone Rd | Kerbside | ✅ | ✅ | The busiest road in London — intentionally high-pollution reference site, not urban background. Excluded. |
| WA7 Wandsworth – Putney High St | Kerbside | ✅ | ✅ | Kerbside on a main road. Excluded. |
KC1 (Kensington and Chelsea – North Kensington, 51.521°N 0.213°W) is LAQN “Urban Background”, open since March 1995, located in a residential street in North Kensington — a direct analogue to the CCNY and IS 52 residential / campus character. It has PM2.5 and NO2 running continuously through end of 2024, with no multi-month gaps. The Jan 2022 NO2 record has ~130 valid hours out of 720 (instrument issue for ~19 days) but this is isolated and the monthly mean is still computable from the remaining data.
Summary: why this pair is the best available match
| Criterion | NYC (CCNY + IS 52) | London (KC1) |
|---|---|---|
| Site classification | Urban Background (EPA) | Urban Background (LAQN) |
| Instrument type | Continuous (TEOM/BAM) | Continuous (TEOM-FDMS) |
| PM2.5 record completeness | 363–366 days/yr, no gaps | Near-complete, no multi-month gaps |
| NO2 record completeness | Near-complete daily | Near-complete, one minor 19-day gap (Jan 2022) |
| Setting | College hilltop / school, residential | Residential street |
| Distance from city centre | ~8 km NW of Midtown | ~5 km W of central London |
The main residual caveat is that CCNY uses a TEOM corrected with a site-specific correction factor, while KC1 uses TEOM-FDMS (a different semi-continuous correction). Both are classified as “indicative” rather than reference-method instruments. Absolute concentrations may differ by a few percent due to instrument systematics, but the inter-annual trends and event structure are robust.
Final station pairs
| PM2.5 | NO2 | |
|---|---|---|
| NYC | CCNY — City College of New York, 160 Convent Ave, Manhattan (40.819°N, 73.948°W). Continuous TEOM instrument (EPA param 88502), 363–366 valid days/year. | IS 52 — Intermediate School 52, South Bronx (40.816°N, 73.902°W), 3.5 km from CCNY. Continuous analyser (EPA param 42602). No Manhattan NO2 monitor exists in the EPA network. |
| London | KC1 — Kensington and Chelsea – North Kensington (51.521°N, 0.213°W). LAQN “Urban Background”, open since 1995, continuous PM2.5 and NO2 through 2024. | Same KC1 site. |
Data sources
NYC (EPA pre-generated daily bulk files, no authentication):
https://aqs.epa.gov/aqsweb/airdata/daily_88502_{year}.zip   # continuous PM2.5
https://aqs.epa.gov/aqsweb/airdata/daily_42602_{year}.zip   # NO2 (ppb)
London (ERG / King’s College London API, no authentication):
https://api.erg.ic.ac.uk/AirQuality/Data/Site/SiteCode=KC1/
    StartDate={YYYY-MM-DD}/EndDate={YYYY-MM-DD}/Json
Returns hourly PM2.5 (µg/m³) and NO2 (µg/m³). Data are fetched by calendar month, cached locally, and resampled to monthly means.
Key findings
Decade means (2015–2024):
| PM2.5 (µg/m³) | NO2 (µg/m³) | |
|---|---|---|
| NYC (CCNY / IS 52) | ~7.7 | ~27 |
| London (KC1 N. Kensington) | ~10 | ~37 |
Counter-intuitively, London’s PM2.5 and NO2 are both higher than NYC’s on a decade average. The PM2.5 gap is driven by London running notably higher concentrations in 2015–2019 (~11–14 µg/m³) before the Ultra Low Emission Zone (ULEZ) was introduced and gradually expanded. By 2022–2024 both cities have converged to similar PM2.5 levels (~6–8 µg/m³). London’s persistently higher NO2 reflects its much larger diesel vehicle fraction and dense street canyons — a pattern that ULEZ has begun to erode but has not yet eliminated.
The wildfire contrast: NYC’s monthly PM2.5 spikes sharply in June 2023 (~40 µg/m³ at CCNY — more than 5× the WHO 2021 guideline in a single month), driven by Canadian boreal wildfire smoke. London’s KC1 shows no such signal. This asymmetry is structural: NYC lies directly downwind of an increasingly fire-prone boreal forest; London, with the Atlantic to the west, does not.
Script: scripts/air_quality.py — downloads and caches all data, generates
the plot above. All data are stored in .cache/ (gitignored) so subsequent
runs use only local files.